Advent of Cyber 2025 - Day 3 - Splunk Basics - Did you SIEM?
Day 3 of Advent of Cyber 2025 introducing Splunk SIEM for investigating a ransomware attack through web traffic and firewall log analysis using Search Processing Language (SPL) queries.

Description
It’s almost Christmas in Wareville, and the team of The Best Festival Company (TBFC) is busy preparing for the big celebration. Everything is running smoothly until the SOC dashboard flashes red. A ransom message suddenly appears:

The message comes from King Malhare, the jealous ruler of HopSec Island, who’s tired of Easter being forgotten. He’s sent his Bandit Bunnies to attack TBFC’s systems and turn Christmas into his new holiday, EAST-mas.
With McSkidy missing and the network under attack, the TBFC SOC team will utilize Splunk to determine how the ransomware infiltrated the system and prevent King Malhare’s plan from being compromised before Christmas.
Learning Objectives:
- Ingest and interpret custom log data in Splunk
- Create and apply custom field extractions
- Use Search Processing Language (SPL) to filter and refine search results
- Conduct an investigation within Splunk to uncover key insights
Introduction
This is the third challenge in this year’s Advent of Cyber hosted by TryHackMe, a 24 day cyber security challenge where new objectives are released every day. Each objective consists of multiple questions and flags we must find on their machines, sometimes by simply following their instructions and other times by needing to find something hidden ourselves. This challenge introduces us to Splunk, a Security Information and Event Management (SIEM) tool used to collect, analyze, and correlate security logs. We’ll be investigating a ransomware attack by examining web traffic and firewall logs to trace the attack chain from initial reconnaissance to data exfiltration. Unlike the previous challenges, we’ll be accessing a web-based Splunk instance rather than connecting via SSH or command line, and we’ll use Search Processing Language (SPL) queries to hunt through the logs and uncover how the attackers compromised the system.
Solving The challenge
The questions below will be answered by using the splunk web interface which has all the logs we need preloaded, which can be accessed via the link on the challenge page.
What is the attacker IP found attacking and compromising the web server?
In order to find this we need to select Search and Reporting on the splunk interface and run the search query index=main sourcetype=web_traffic, ensuring that the time window to the right of the search bar is set to “All time”. However, this returns way too many results, most of which are legitimate. To remedy this, we will instead use the query index=main sourcetype=web_traffic user_agent!=*Mozilla* user_agent!=*Chrome* user_agent!=*Safari* user_agent!=*Firefox*, which ignores requests from common browsers such as Firefox or Google Chrome.
Doing so still returns over 7,000 results, however by looking at the left hand panel under client_ip we can see that every request is only coming from the IP 198.51.100.55, which is the malicious IP
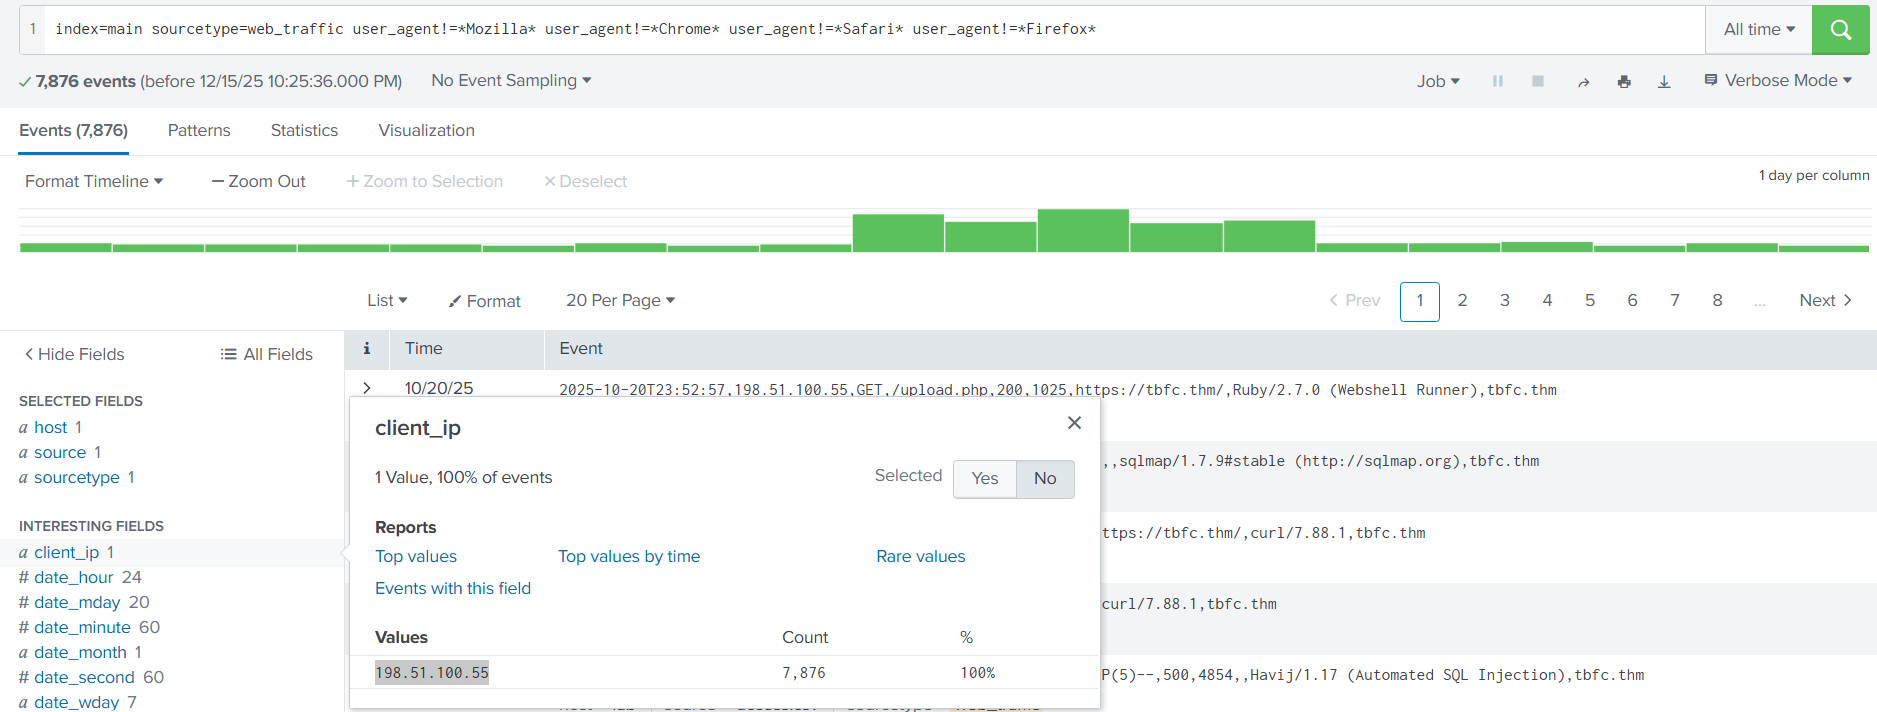
Answer: 198.51.100.55
Which day was the peak traffic in the logs? (Format: YYYY-MM-DD)
In order to find this we can run the query index=main sourcetype=web_traffic | timechart span=1d count, which searches all the web logs and then pipes the results into timechart span=1d count, grouping the results by day. From there we can just use the sort button that says “count” on the right hand side to find the day with the most entries.
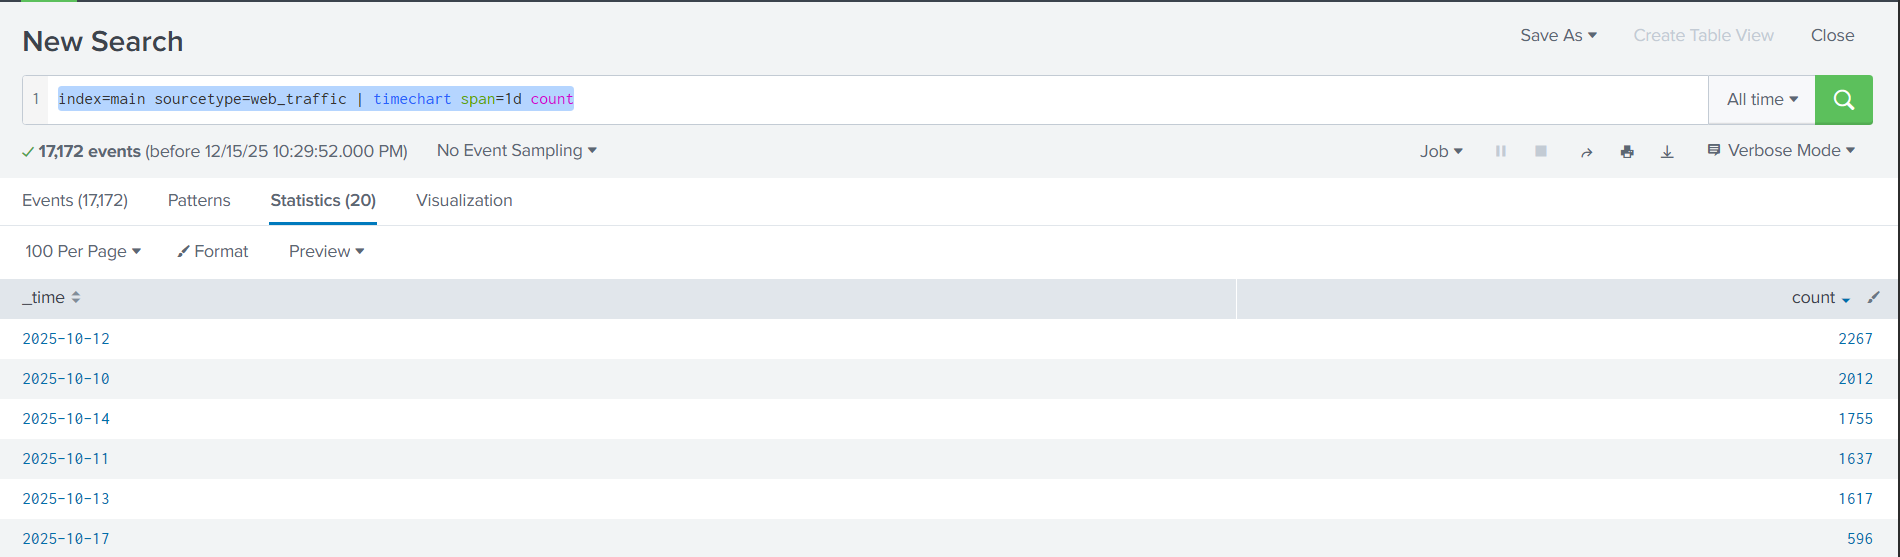
Answer: 2025-10-12
What is the count of Havij user_agent events found in the logs?
To find this we can simply run the query index=main sourcetype=web_traffic user_agent=*Havij* | stats count, which just like before searches all web_traffic logs except this time it only returns events explicitly with the user_agent Havij
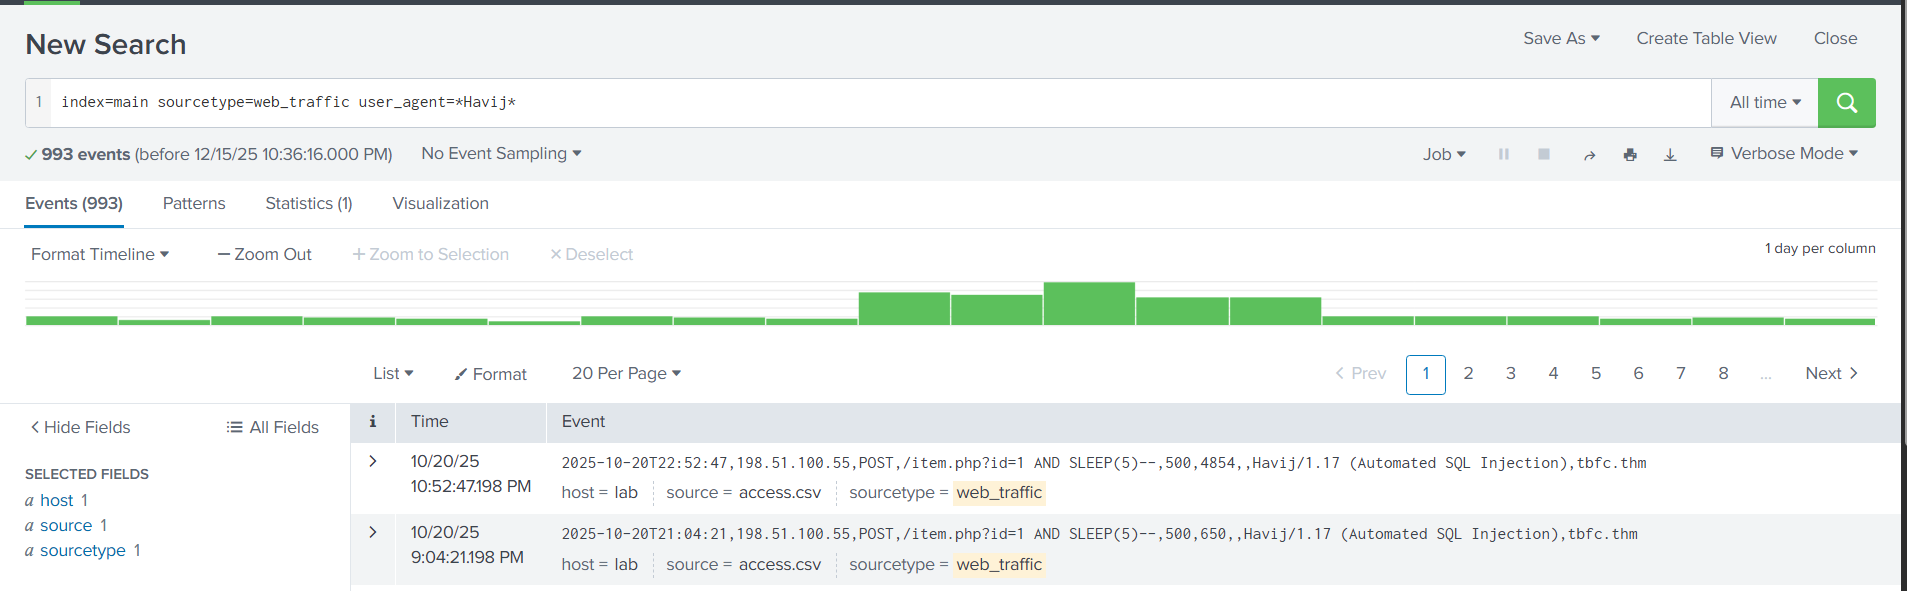
As we can see, the search returned 993 events.
Answer: 993
How many path traversal attempts to access sensitive files on the server were observed?
Path traversal is done using .., which allows the user to go up one directory, and can be chained using / to go up multiple directories. For example, ../../ will go up two directories. These are common for attackers to use since you do not need to actually know the name of the directories you are traversing.
Because of this we simply need to refine our search to search for events that include the string ../../, which can be done with the query sourcetype=web_traffic client_ip="198.51.100.55" AND path="*..\/..\/*" | stats count by path
There are a few things to understand about this query:
- It only searches for web logs specifically from the malicious IP
- It only returns events that have the
../../string - Uses the wildcard character
*after the string to match any characters that come after the traversal pattern, capturing all variations of path traversal attempts regardless of what file or directory the attacker was trying to access - Uses
\before each/as an escape character, basically telling splunk to treat each/as just a normal character, since they typically serve other purposes in splunk search queries
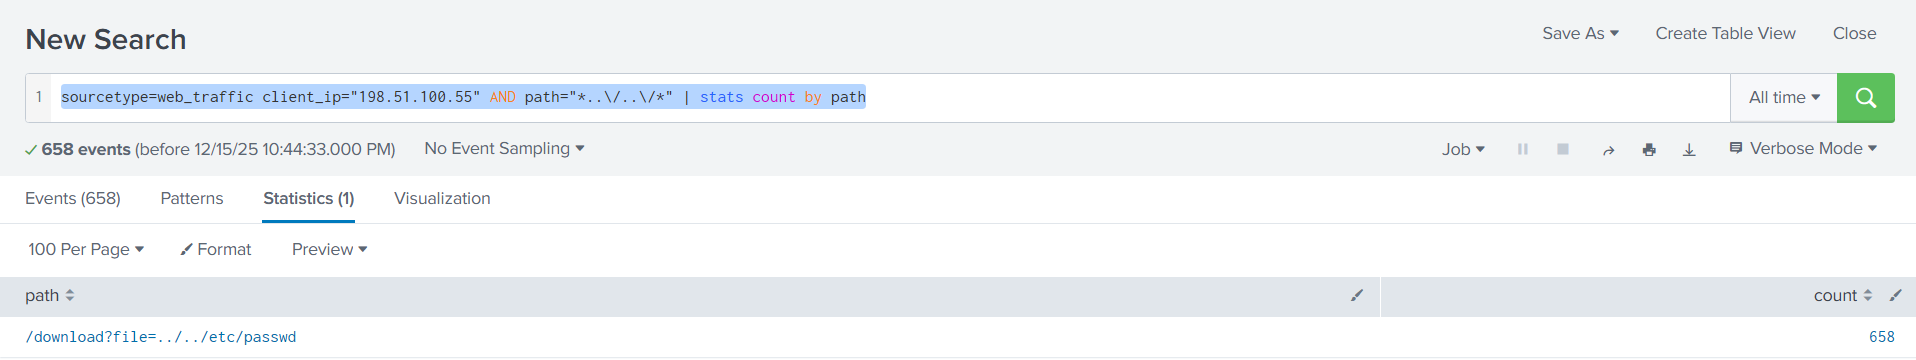
Answer: 658
Examine the firewall logs. How many bytes were transferred to the C2 server IP from the compromised web server?
For this question we need to move from looking at web_traffic to firewall_logs. We know the source IP address is 10.10.1.5, and the malicious IP is 198.51.100.55, so we need to craft a query that searches for every connection ALLOWED to pass through by the fire wall. Taking all of these factors into account we come up with the query sourcetype=firewall_logs src_ip="10.10.1.5" AND dest_ip="198.51.100.55" AND action="ALLOWED".
However, this only returns every event that matches those parameters, when what we really need is the sum of all the bytes transferred across every request. To do this we can take our query and pipe it into the stats command to run statistical analysis on the returned events. We then use sum(bytes_transferred) to add up all the values of the bytes_transferred field from each event and displays it as a single, readable total. Finally, we can use by src_ip to group the results by source IP, ensuring we are only looking at bytes originating from our compromised server. With all of this the final command becomes stats sum(bytes_transferred) by src_ip
Combining our initial query and our command the final query we need to use becomes sourcetype=firewall_logs src_ip="10.10.1.5" AND dest_ip="198.51.100.55" AND action="ALLOWED" | stats sum(bytes_transferred) by src_ip
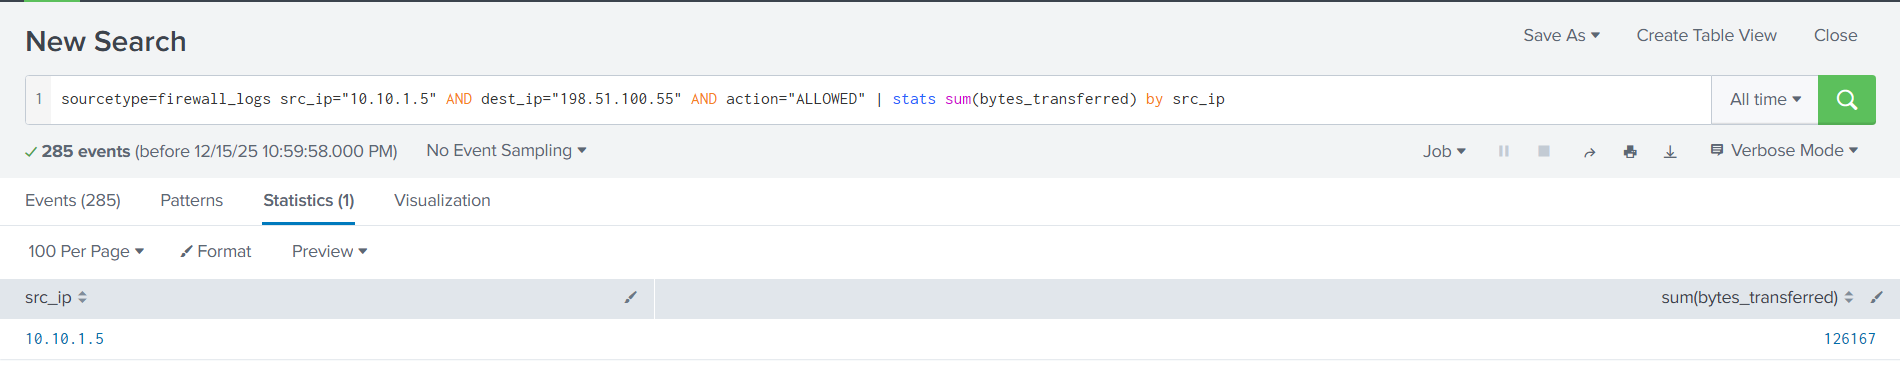
Answer: 126167